
Mural paintings
Leonard Ornstein investigates the random walk
What do we see here?

This mural painting shows the drunkard walk, an example of the random walk professor Leonard Ornstein (1880-1941) investigated. You can visit this mural at Oosterkade 30 in Utrecht.
The random walk is a series of random consecutive steps an object can make. This theory is used to create models for predictions, like stock prices or how a floating object moves across the water. The random walk is also called the drunkard walk. Sometimes it seems completely random in what direction a drunkard is walking.
Leonard Salomon Ornstein was born on November 12 1880 in Nijmegen. He studied physics in Leiden and got his PhD in applications of static mechanics on molecular theoretic problems. He started teaching physics in 1909 in Groningen, but switched to Utrecht in 1914.
In his career Ornstein had studied a broad range of topics within physics, like magnetism, liquid crystals and measurements to light intensity. Since November 1940 jewish scientists were banned from university during the Second World War. Ornstein was among those who were fired. In this period Ornstein suffered from heart problems and he died on May 20 1941. Ornstein had five children from two marriages. One of his grandsons, also called Leonard Ornstein, is a famous Dutch journalist.
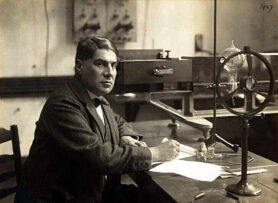
Ornstein in 1927
Ornstein started teaching theoretical physics at Utrecht University in 1914. He temporarily replaced Willem Julius, the director of the Utrecht physics laboratory, in 1920. After Julius’ death in 1925 Ornstein became director permanently. In his time in Utrecht Ornstein was the promotor of 95 researchers. among them was the famous astronomer Marcel Minnaert. In 1931 and 1932 he was rector magnificus of Utrecht University.
Along with George Uhlenbeck Ornstein developed the Ornstein-Uhlenbeck process in 1930. This process is a variant on the random walk. The random walk is a series of random consecutive steps an object makes.
Experts use this principle to build models to make certain predictions, for example how pollen will scatter in the wind, the route an animal will take looking for food or how stock prices will change.
The variant Ornstein and Uhlenbeck made takes the velocity of this movement into account and states that every step that is taken will go more and more towards the average step.
In this period Ornstein and Uhlenbeck investigated how to determine the role of velocity in random walks. They used Newton’s second law for this. This law states that the velocity of a moving object depends on the forces exerted on it. Based on this law and other formulas around the random walk they made this formula:
dxt = -ϴxtdt +σdWt
Let’s explain this formula by using an example. A drunkard walks out of their favourite pub. Now we want to know which way they will walk. The starting point is the door of the pub. We call this place xt and at the beginning this is 0 cm, so xt = 0 cm.
To measure time we use the value t and express this in seconds (s). We call the moment the walk starts t = 0 s. The person takes a wobbly step of 50 centimetres forward and it takes one second. After this second we have xt = 50 cm forward and t = 1 s.
While the next second passes the person takes another step, now diagonally forward. The position is for example (xt = 80 cm forward, 40 cm sideward and t = 2). In the next second the person struggles to maintain balance and almost falls over and takes a diagonal step backwards. The position is now
(xt = 40 cm forward, 10 cm sideward and t = 3 s). You do not know what direction the person will take the next step in. This is random.
We can describe how this person walks with the formula Ornstein and Uhlenbeck developed and you can see on the painting:
dxt = -ϴ xt dt + σ dWt
dxt stands for the change in an object’s position in a certain time. dxt = 50 centimetre in the example above. The first part of the formula after the = symbol consists of three parts that are multiplied: ϴ, xt and dt.
The symbol ϴ is de Greek letter theta and it is a constant factor. Theta determines how fast a movement will go back to the average value after an outlier, xt is the position of an object at a certain time and dt is the step in time (it is 1 second in the example above).
The second part consists of two factors that are multiplied: σ and dWt. dWt describes the possible outcomes of a random process. There are possiblilites in every step. In the example above the person can bove forward, backward, to the left or to the right. The first step will go forward and the next diagonally forward. σ is the Greek letter sigma and this stands for how big the steps are.
In this animation you can see an example of a random walk. In this case a particle moves in a room with other particles that will collide and change direction at random moments.